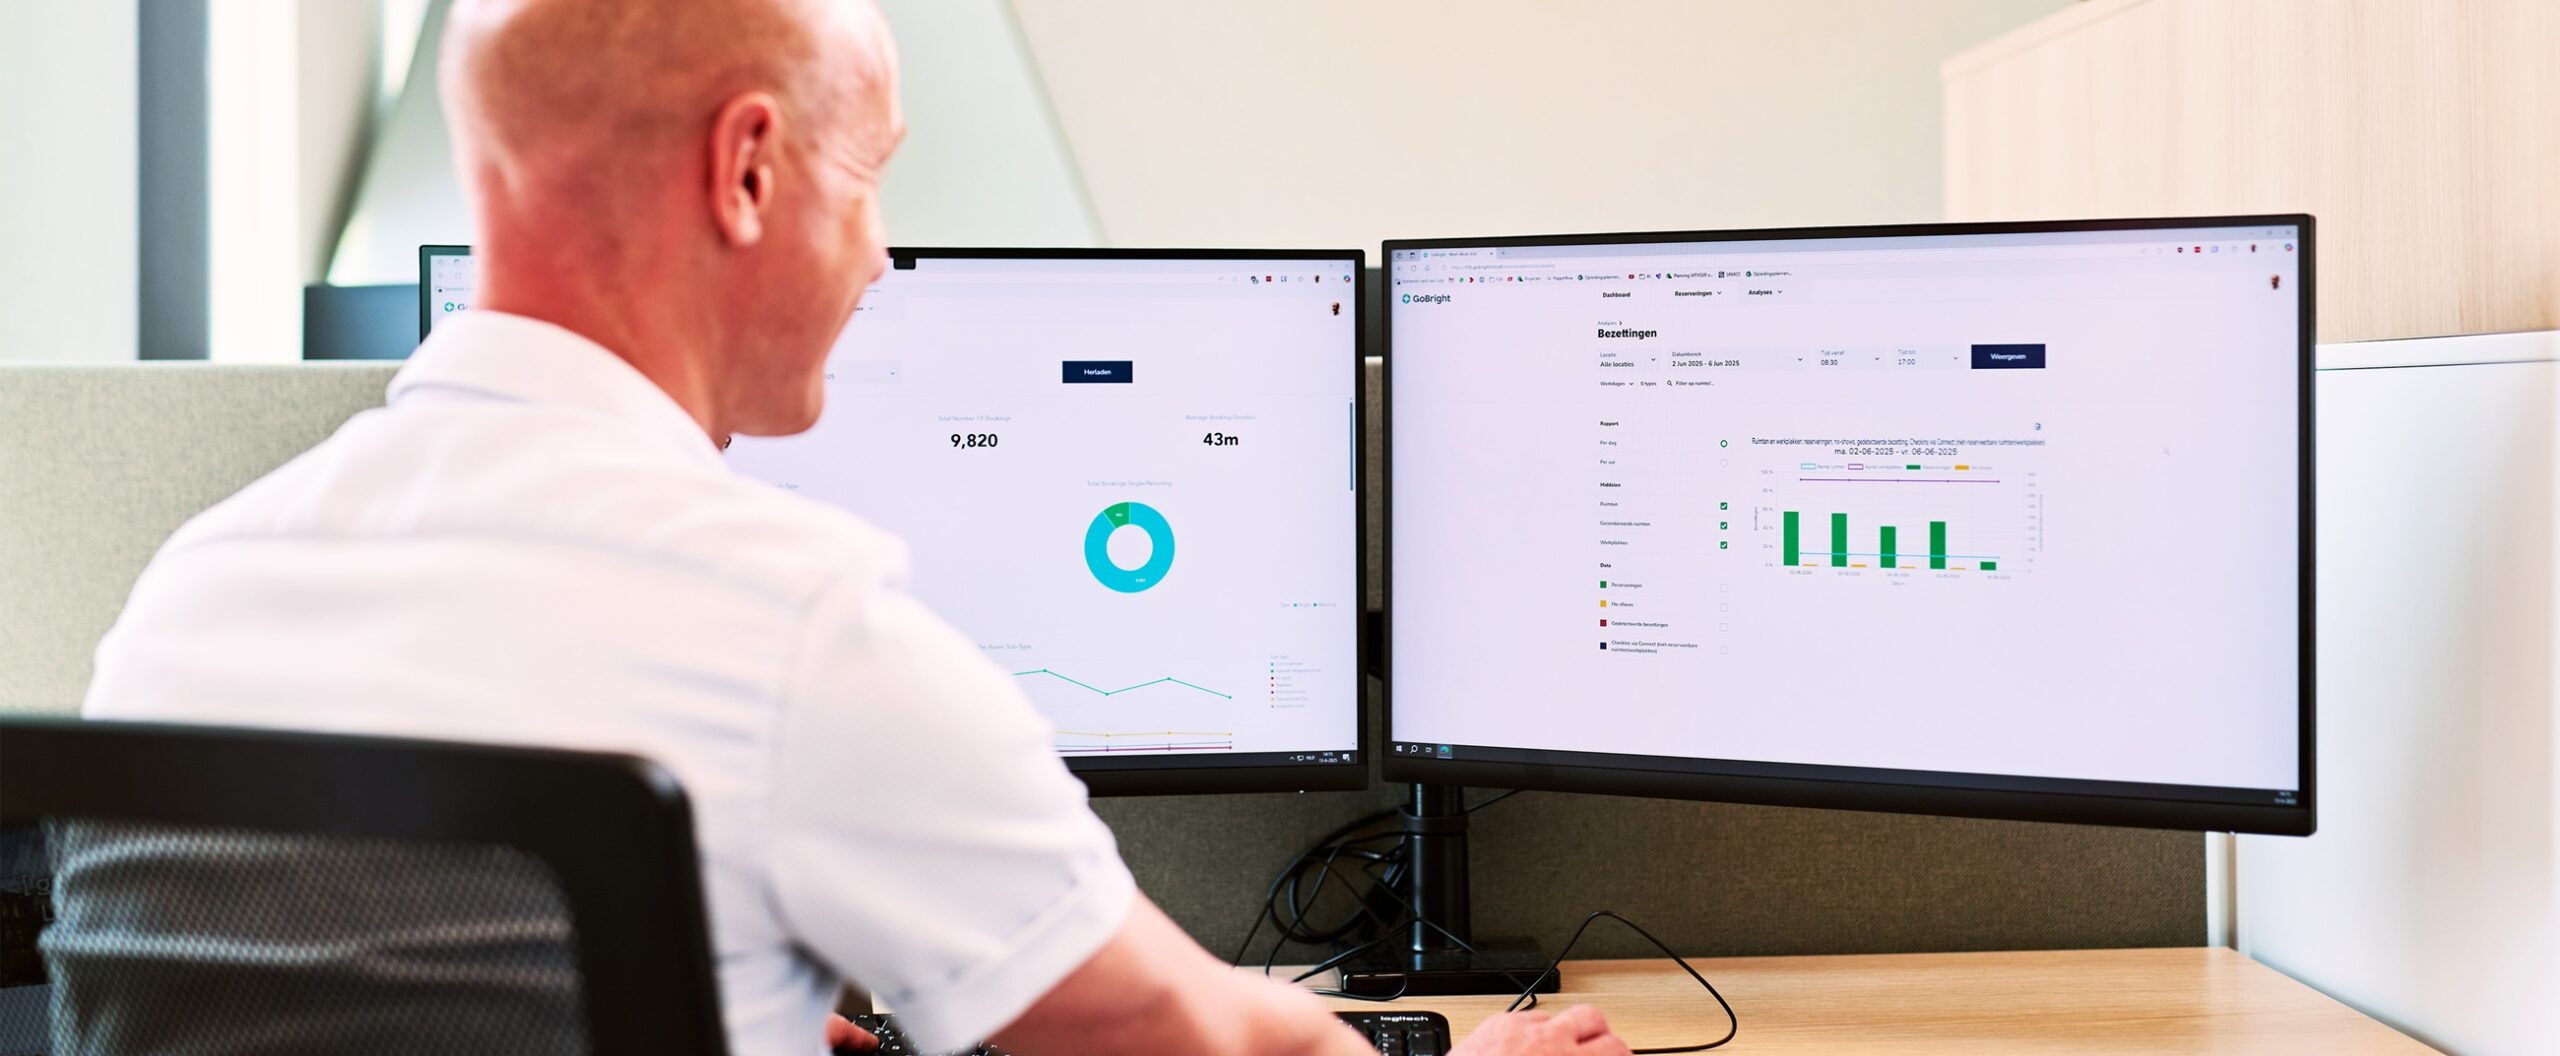
How the Behaviour Dashboard Works
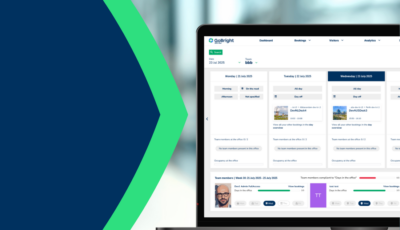
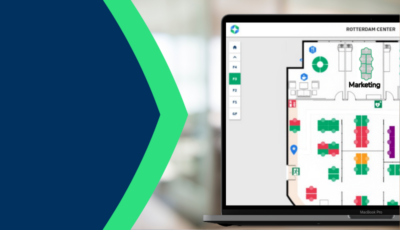
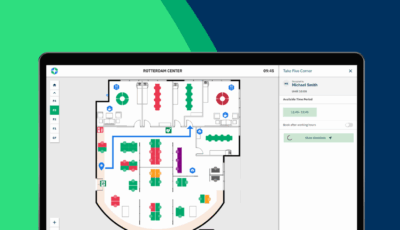
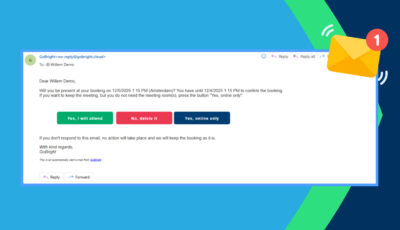
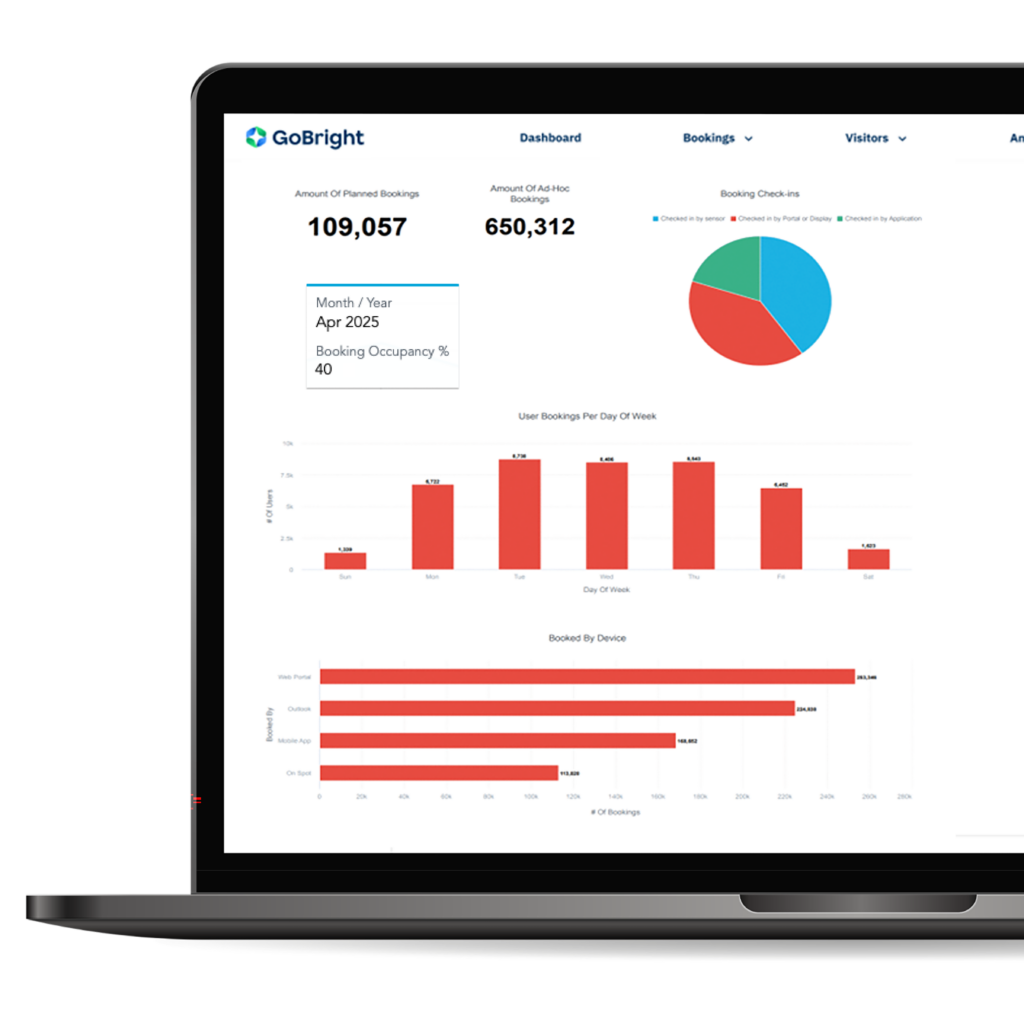
The dashboard shows which departments use specific areas and when, enabling you to design office layouts around actual team behaviour. You can understand how employees make bookings—whether via portal, app, or Outlook—and whether certain methods correlate with higher no-show rates.
The dashboard tracks how far in advance bookings are made and correlates this with actual usage. Bookings made weeks in advance frequently have higher no-show rates than same-day bookings. By connecting booking timing with no-show percentages, you can identify patterns that waste workspace and adjust policies accordingly.
Beyond historical analysis, AI-driven forecasting predicts future occupancy for desks, rooms, and parking spaces to support strategic decisions like consolidating floors based on expected demand. Real-time analytics monitor current department occupancy, system usage, and actual team attendance compared to bookings, enabling rapid response to changing patterns.
Why the Behaviour Dashboard Matters
The Behaviour Dashboard helps improve return on investment by identifying underused assets and revealing where resources are genuinely needed. You can make informed decisions that directly impact the bottom line whilst reducing waste through targeted interventions rather than blanket policies.
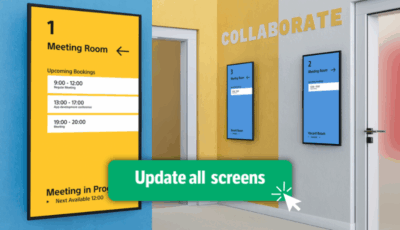
By showing actual demand patterns across departments, days, and seasons, the dashboard enables you to align capacity and facility services with real usage. This evidence supports confident strategic decisions; consolidating floors, redesigning zones, implementing new policies, backed by data rather than assumptions.
Understanding behaviour means creating a workplace that genuinely works for its people rather than one designed around theoretical models. The dashboard enables organisations to move from assumption-based to evidence-based workplace management, with clear data showing how changes will impact real usage patterns.
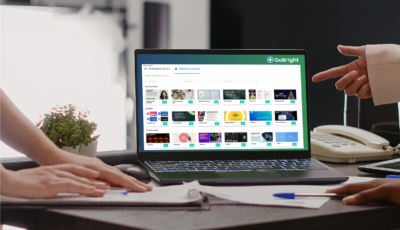
Want to know more?
Discover how the Behaviour Dashboard can unlock strategic insights from your workplace data. Our Smart Workplace Experts can demonstrate the analytics in action and help you get started with behaviour-driven workplace optimisation.