GoBright Analytics
People always exhibit certain behaviours and have preferences for specific workspaces, quiet rooms, or even favour one meeting room over the other. There are reasons behind these choices. Without measurable data, employers can only guess at the desires and needs of their employees.
- Gain insights into employee behaviour at the office;
- Discover favourite spots and underused facilities;
- Adapt your workplace strategy accordingly.
What is GoBright Analytics?
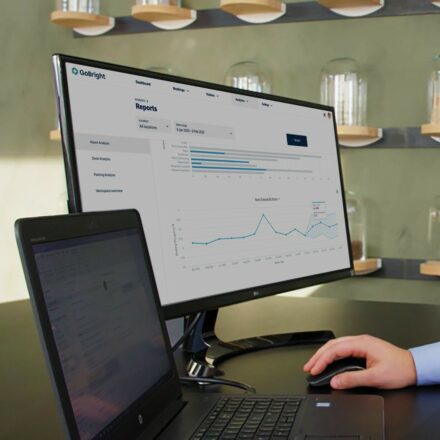
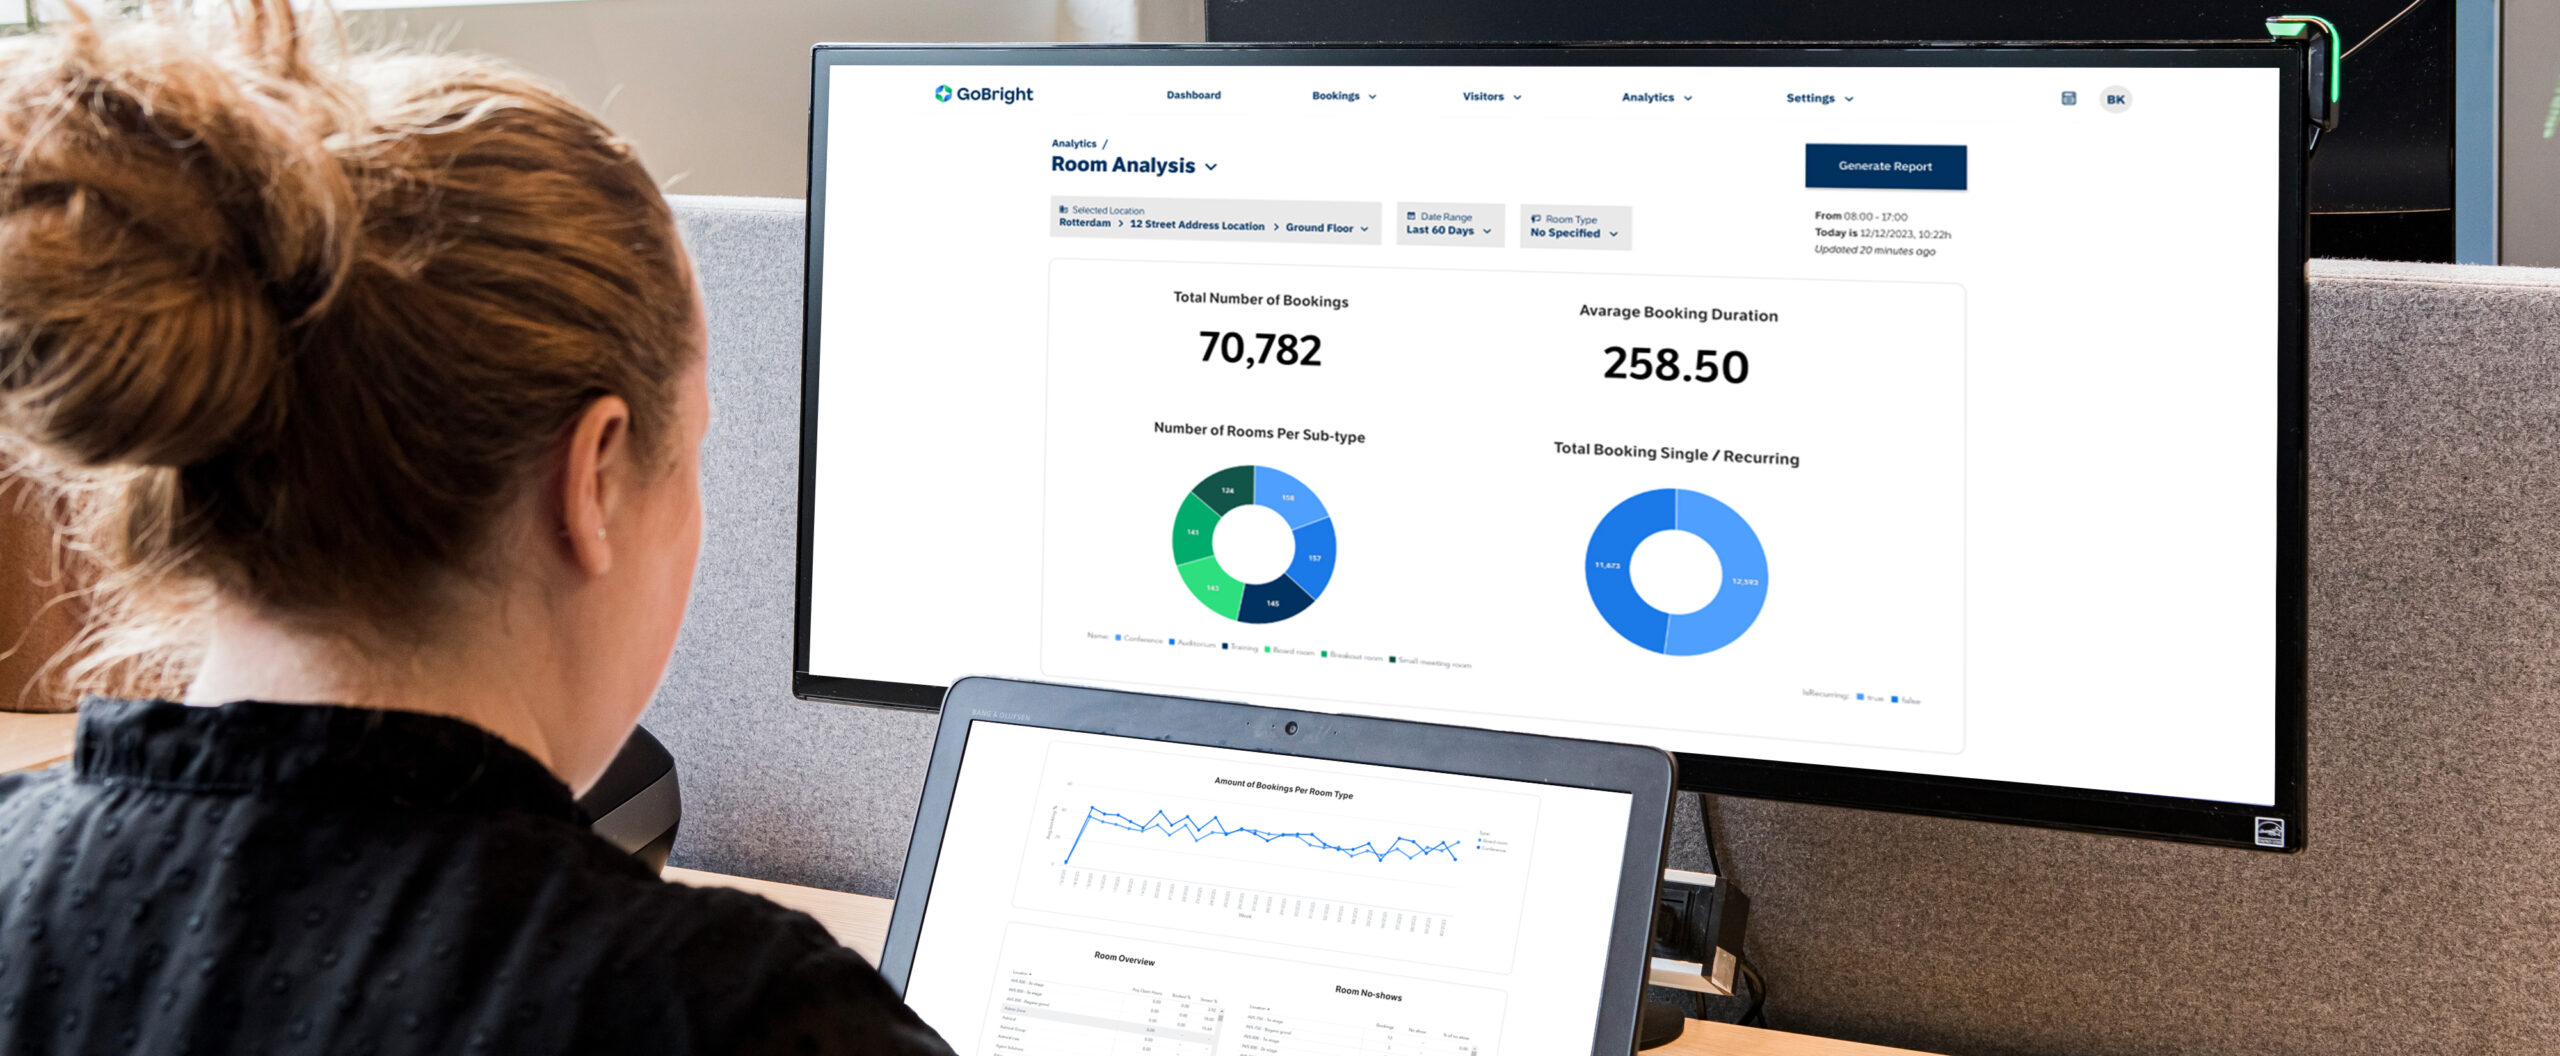
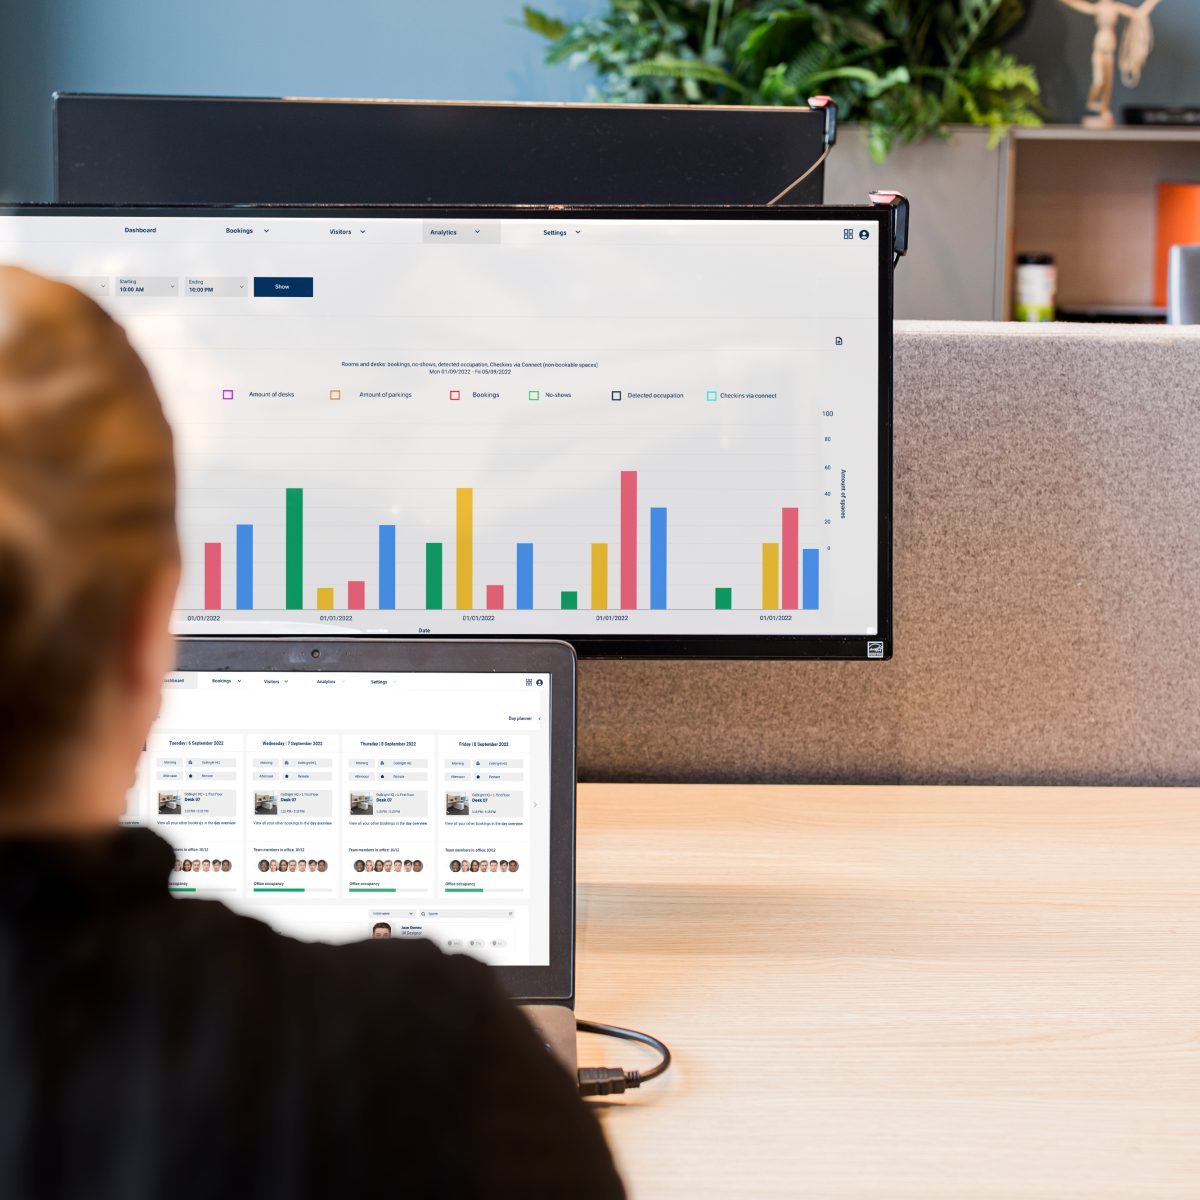
Analytics is GoBright’s Workplace Analytics tool, which you can use to analyse employee behaviour and office space usage. We offer two different packages; Basic Analytics and Advanced Analytics.
GoBright Basic Analytics provides you with important insights into workplace performance, occupancy rates, and utilisation. It includes both real-time and historical data, allowing accurate predictions for optimal future office usage. Collect data such as:
The data is initially collected based on made bookings, and check-ins and -outs made in the GoBright App or Portal, but can be optimised by implementing sensors. These can help prevent irregular data by eliminating no-shows and unregistered bookings, because sensors allow for automatic check-ins and can release booked spaces due to inactivity.
By using this information, you can efficiently (re)design your workplace, benefiting both your employees and your visitors. Make office life a better experience with GoBright.
What are the advantages of workplace analytics?
Workplace Analytics give you objective insight into workplace statistics. From occupation and utilisation to all other measurable actions. This can have many advantages:
Optimising the workplace
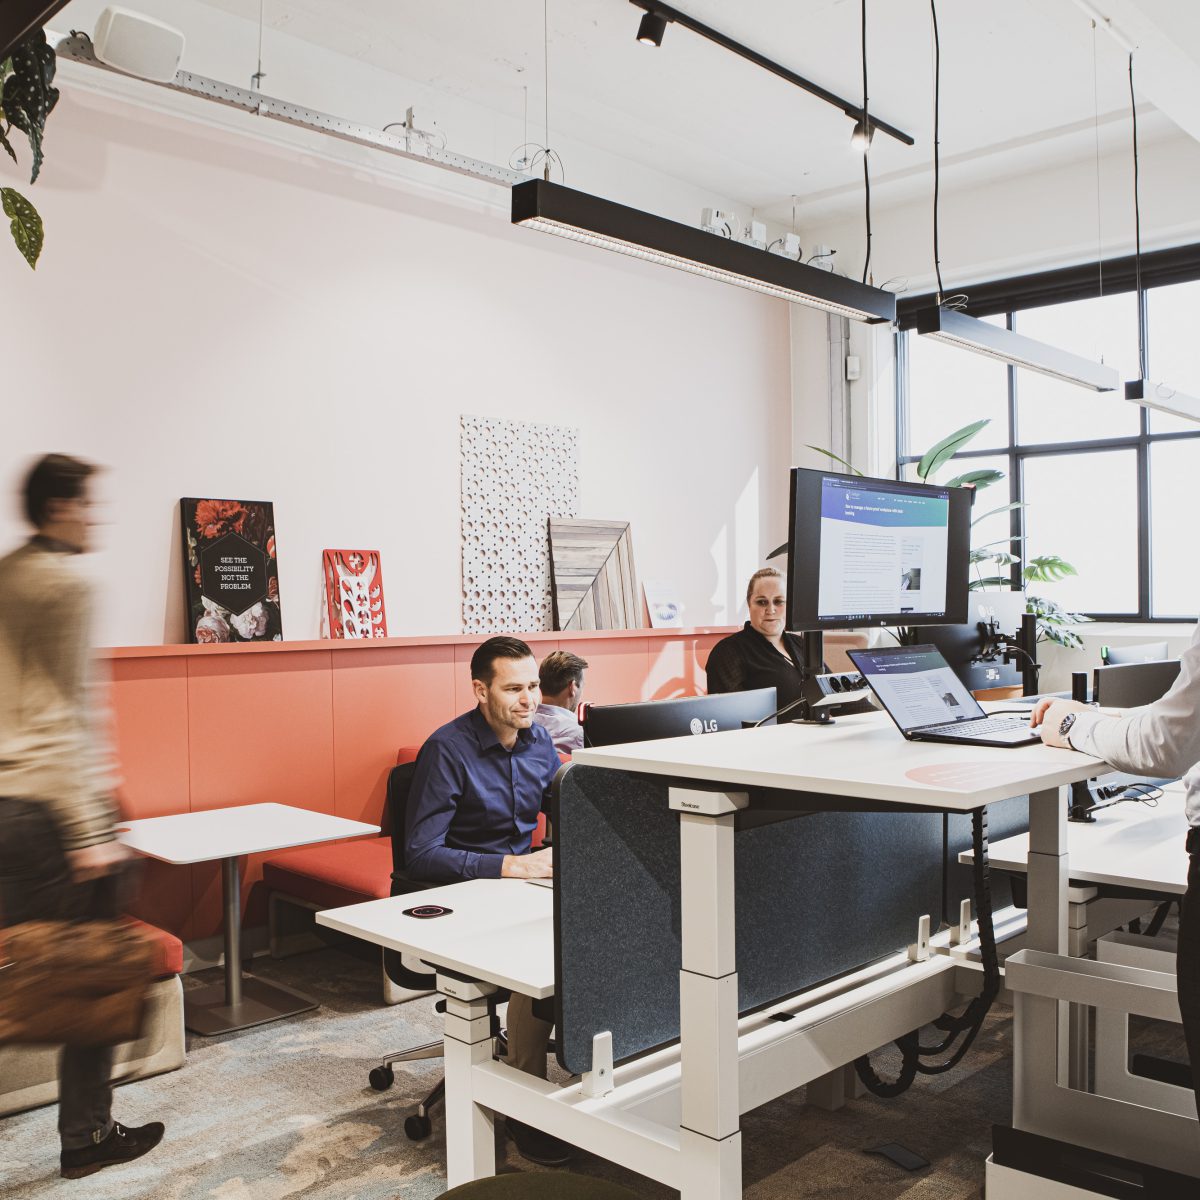
Workplace Analytics in combination with Room Booking and Desk Booking may show that your office is under- or overoccupied. You may find out that due to the increasing popularity of Hybrid Working, only half of your desks are used by your employees. You could get rid of some of these desks, and use the space for something else your office might need. In some cases, it even turns out that an entire floor is not being used. Dropping this space can save you a lot of money.
Creating a human-centered environment
When you use certain Workplace Analytics, you get insights in employee behaviour. Which desks are used most, and which aren’t as popular? This way you can start to understand your employees’ behaviour and preferences. With an accurate and real-time overview you can start building a user-centered work environment, and continually adapt the environment to align with changing needs and preferences. By designing the workplace smart and efficiently, money can be saved on floorspace and unused desks (or rooms) are no longer an issue.
GoBright Analytics in Power BI
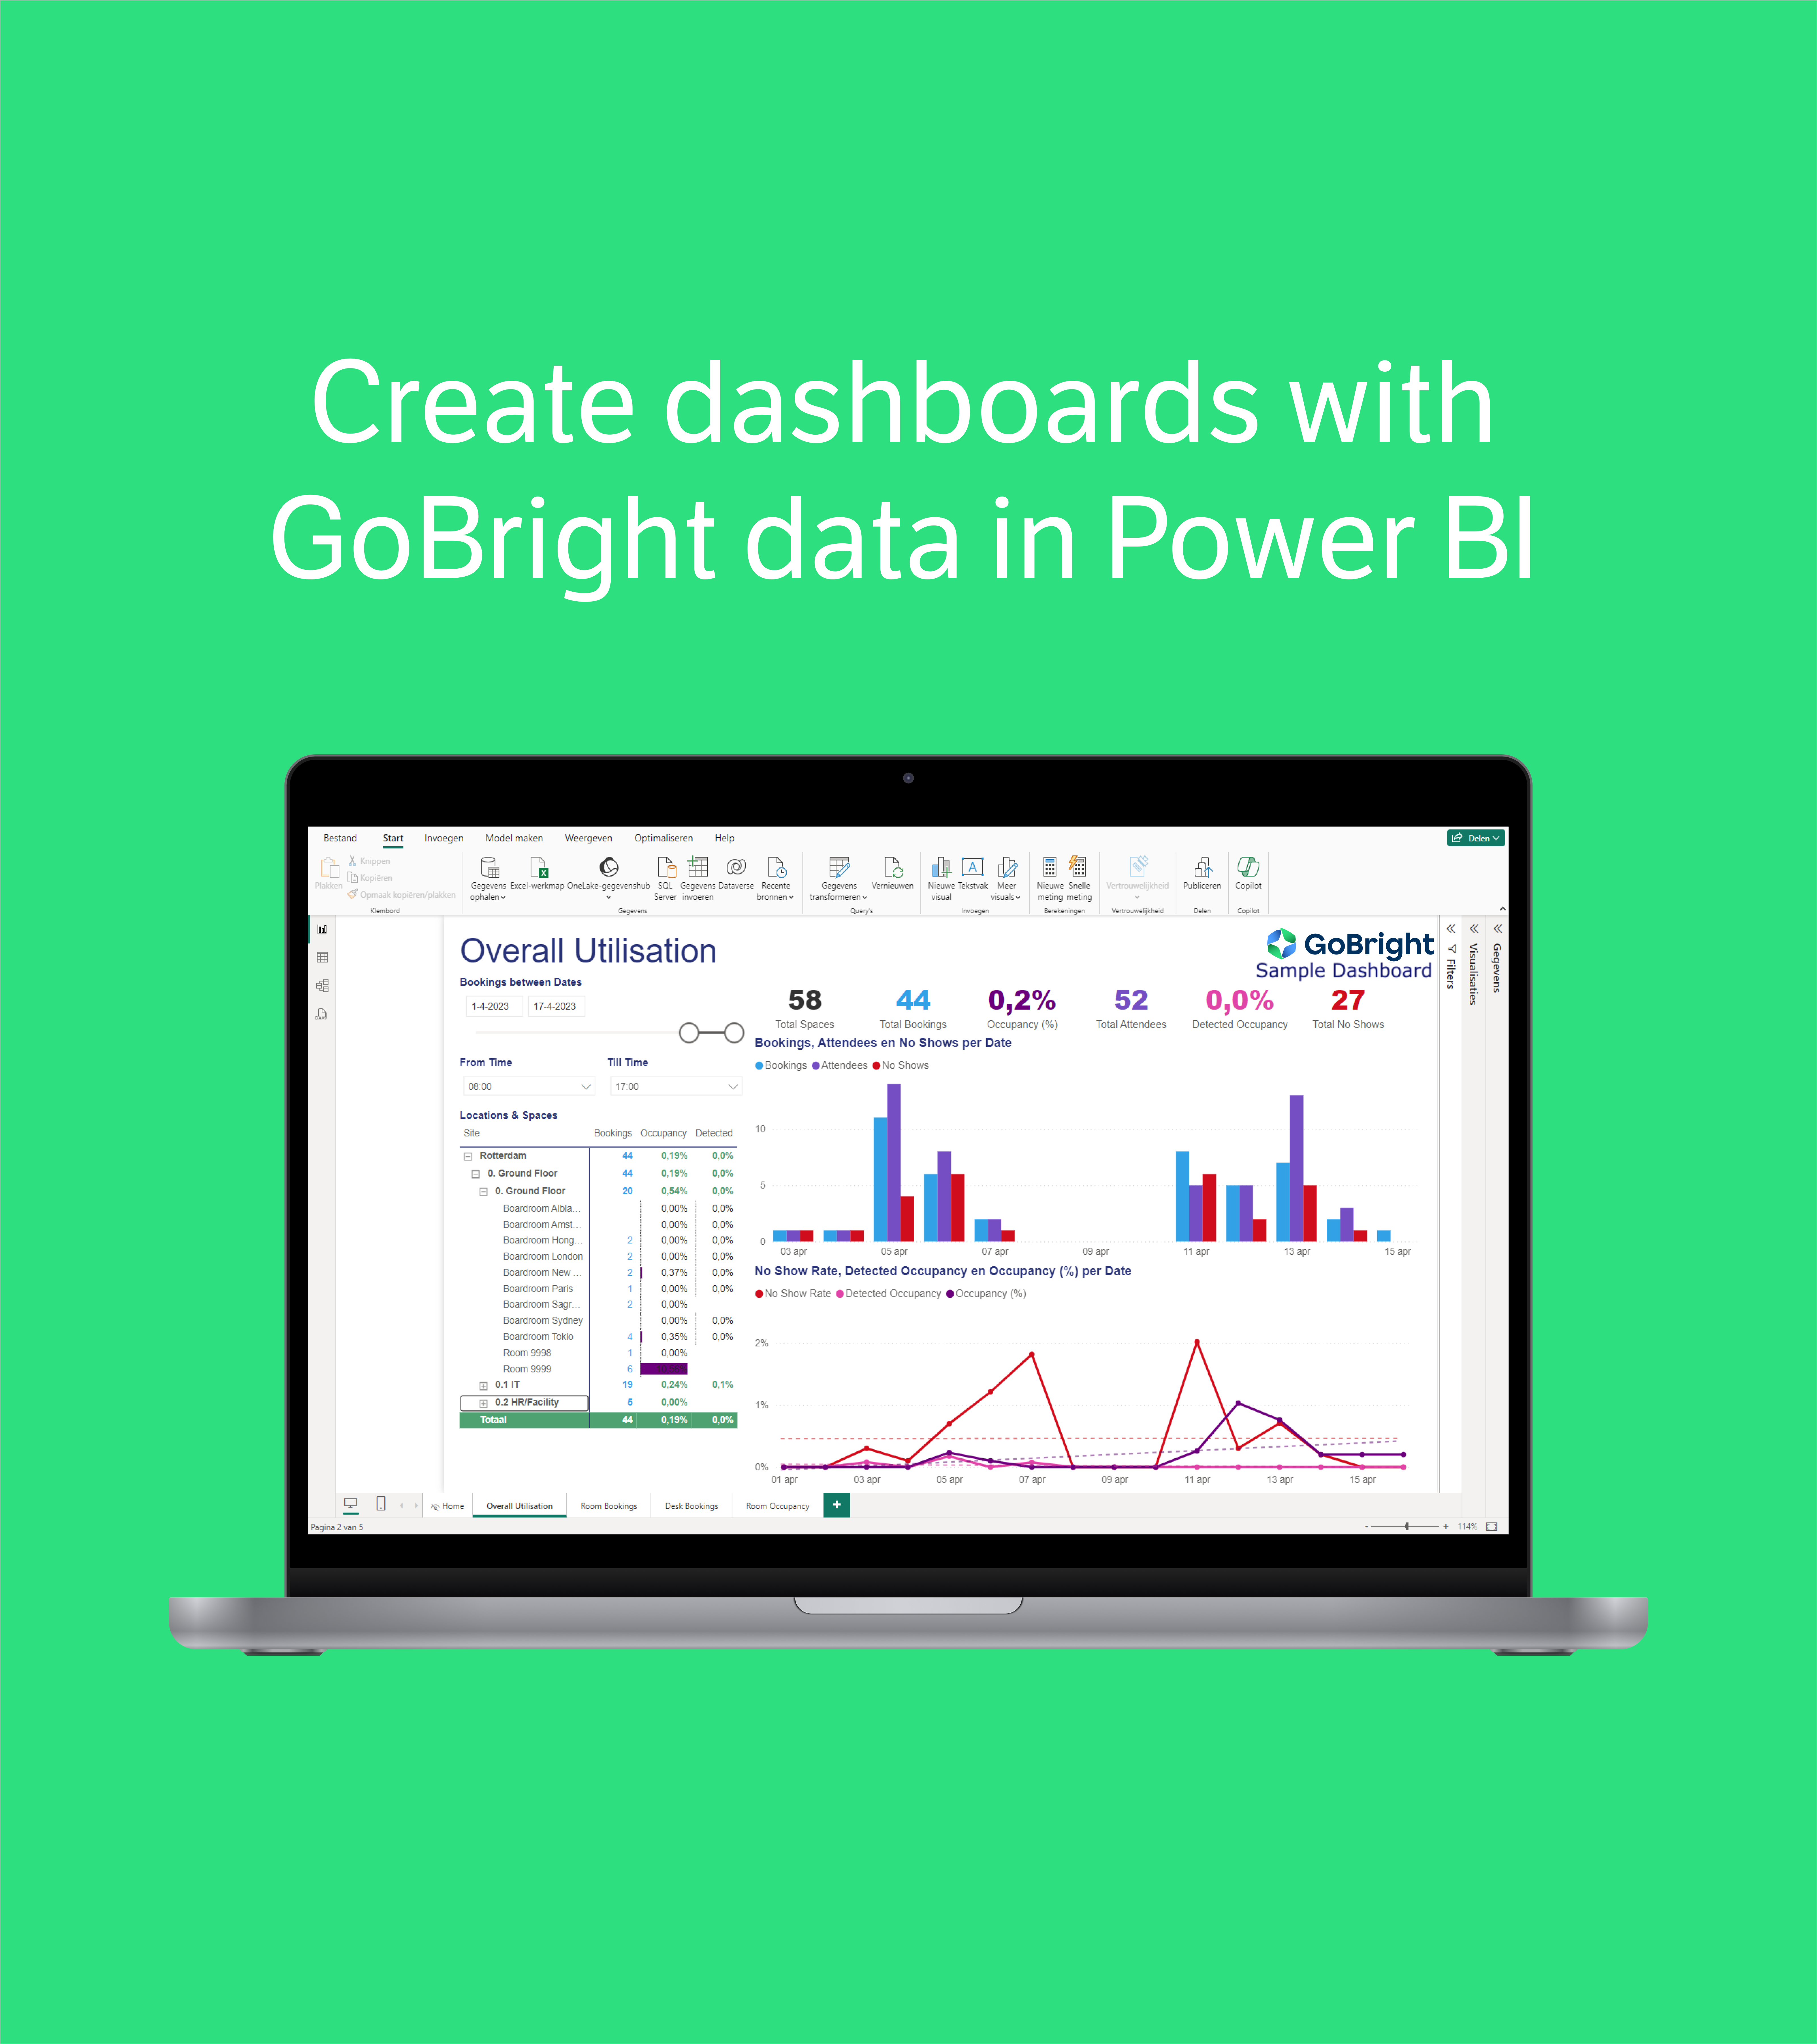
A data-driven office collects many different types of data to optimise their office. This means that you might want to combine information from GoBright Analytics with other sources of data. This is why we have developed an integration with Microsoft Power BI. This way, users can easily create insightful dashboards in which they can incorporate data from multiple different sources.
Of course, these Power BI dashboards can also be displayed on GoBright’s Digital Signage displays.
Advanced Analytics
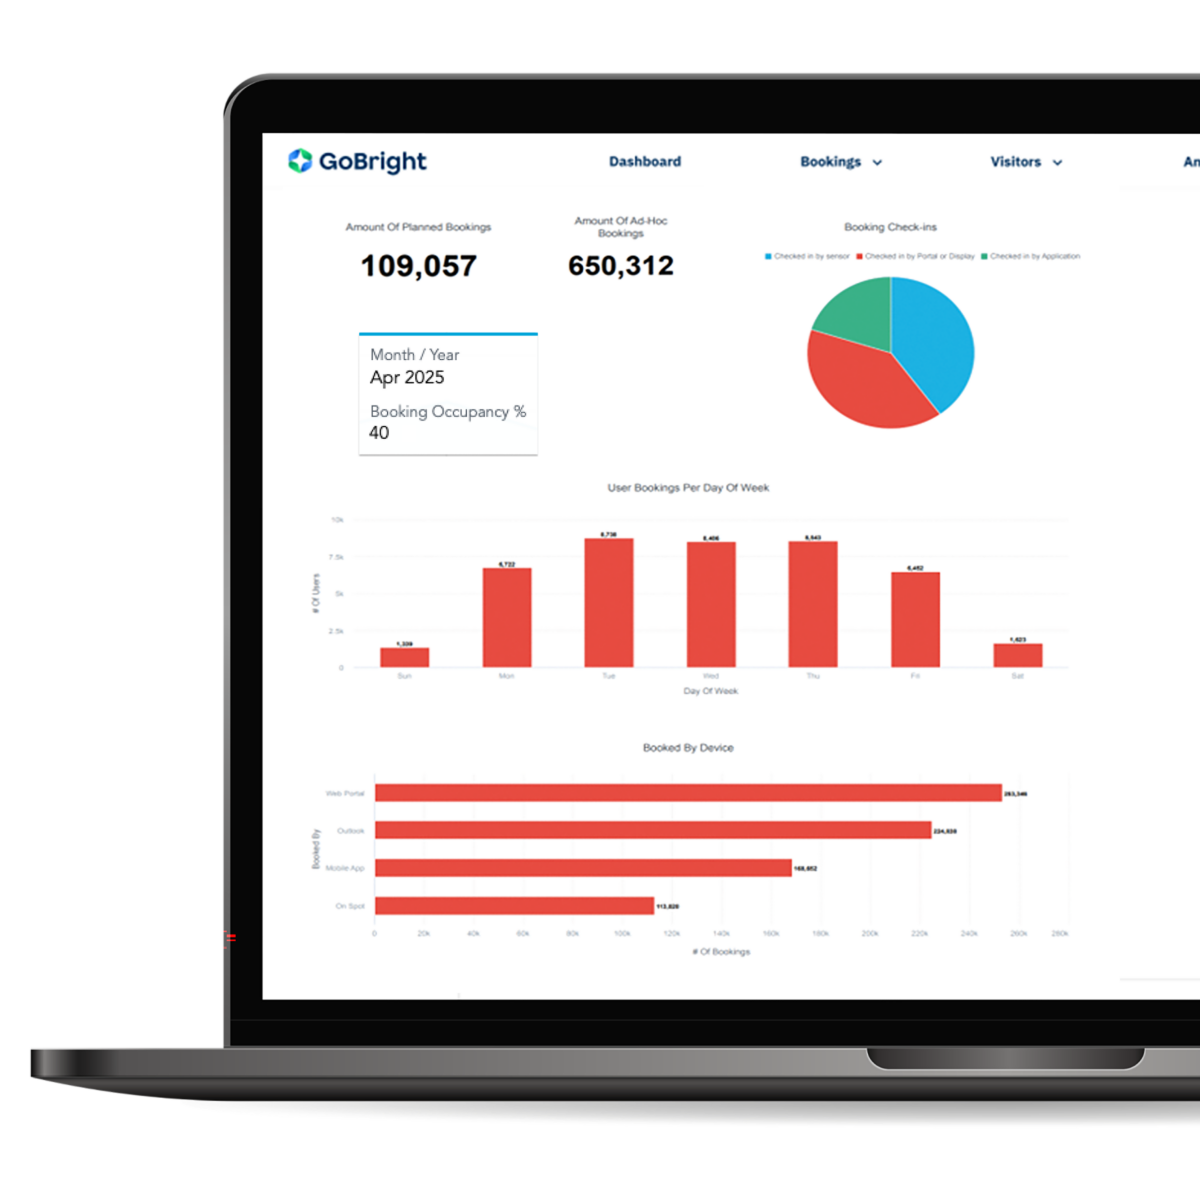
In addition to GoBright Basic Analytics, we are excited to present an upgraded version of our workplace analytics tool to optimise your smart workplace. The Advanced Analytics tool introduces additional dashboards with more detailed analyses, options for forecasting, and the option to integrate Issue Reporting. With these two distinct tools, we hope to accomodate all of our customers.
Behaviour Dashboard Part of Advanced Analytics
Turn workplace behaviour into measurable value.
The Behaviour Dashboard is the newest addition to GoBright Advanced
Move beyond occupancy metrics to understand workplace behaviour. The Behaviour Dashboard reveals which departments use which spaces, how booking methods affect no-shows, and how advance booking patterns correlate with actual attendance. AI-powered forecasting predicts future demand, whilst real-time analytics show current usage across teams and areas. Turn workplace data into strategic decisions that reduce waste and improve ROI.
let’s make your workplace
smarter, together
Reach out to Chris
our CCO

Integrations for GoBright Analytics
GoBright has a variety of integrations that help optimise the office experience.
